
The Bullish Harami candlestick pattern is like a little signal on a price chart that suggests a change might be coming in a downward trend. It happens when you see two candles—one big and red (meaning prices went down), followed by a smaller green one (prices went up a bit). The green candle fits inside the red one. When traders spot this pattern, they might think the downward trend could be turning around.
What is Bullish Harami Candlestick?
The Bullish Harami Candlestick is like a little clue on a stock chart that suggests a change might happen from a downward trend to an upward one. It’s made up of two candles: first, a big red one (prices went down), and then a smaller green one (prices went up a bit). The green candle fits inside the red one, like a baby inside its mom. This pattern is called “Harami,” which is a Japanese word meaning “pregnant.” The small green candle opens near the middle of the big red one, showing that things might be turning around.

The Bullish Harami Cross
In the Bullish Harami Cross pattern, traders pay attention to the second candle, which is often a Doji. A Doji shows uncertainty in the market because the opening and closing prices are very close. The color of the Doji candle isn’t super important here. What matters is that it shows up near the end of a downward trend, suggesting that things might start going up. This pattern offers a good opportunity for traders because it indicates that a bullish (positive) move is just getting started, and there’s potential for good rewards compared to the risk.
How To Identify The Bullish Harami Candlestick Pattern
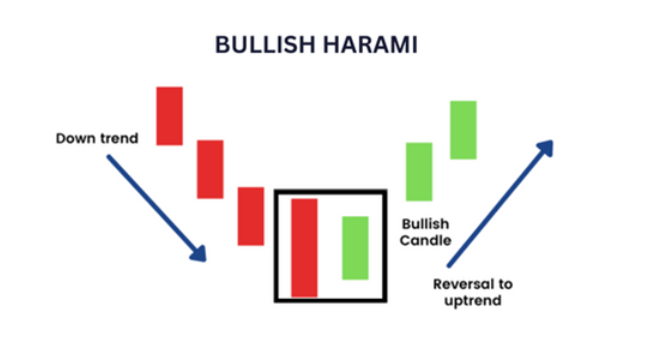
When you’re looking at a trading chart, you might spot a bullish harami candlestick pattern. This happens when you see a big red candle followed by a smaller green one that fits inside the first candle. This pattern suggests that the downward trend might be losing steam, and things could start going up. To make sure it’s a real bullish harami setup, look for a few key things:

i. The first thing to look for is a big red candle. This means there was a lot of selling going on, and the price dropped significantly. It should stand out as one of the bigger candles on the chart, showing that the sellers were in control.
ii. the second candle. It should start inside the big red candle from the first step but end without touching it. This smaller green candle shows that buyers are starting to take back some control, which could mean the price is going to start going up.
It’s important that the big red candle and the smaller green one in the bullish harami pattern look different in color. If they’re both the same color, the pattern isn’t as important.
Also, the size of the two candles is crucial. The second candle should be much smaller than the first one, at least half its size. This shows that the selling pressure is easing up, which is a good sign that the price might start going up.

How is a Bullish Harami Candlestick Pattern structured?
A bullish harami candlestick pattern happens when there’s a big red candle followed by a smaller green one. The green candle has to fit completely inside the red one to make the pattern. It’s like a smaller candle being tucked inside a bigger one, showing that the downward trend might be ending and things could start going up.
When does the Bullish Harami Candlestick Pattern appear?
When a bullish harami candlestick pattern shows up, it usually means the downward trend is coming to an end. This pattern suggests that the prices might start going up soon. Imagine it like a signal that things could be changing direction, like when a traffic light turns green after being red for a while.

How common is the Bullish Harami Candlestick Pattern?
The bullish harami pattern shows up quite often on price charts. In fact, it’s ranked twenty-fifth in terms of how often it appears. This means it pops up frequently enough that you can spot it pretty easily when you’re looking at charts. It’s like seeing a common bird in your backyard—you’re likely to notice it without too much effort.
How Can me Trade the Stock Market Using the Bullish Harami Candlestick Pattern?
Identification of the pattern
To use the bullish Harami pattern for trading stocks, you first need to spot it on the price chart. Look for a big red candlestick followed by a smaller green one. This is the bullish Harami pattern. It’s like finding a big storm cloud followed by a little sunshine peeking through—it signals that the bad times might be ending and some good times could be on the way.

Confirmation of the pattern
Before you start trading using the bullish Harami pattern, you need to make sure you’re seeing it correctly on the stock chart. Look for the third or fourth candlestick after the pattern starts. If you see a green candlestick that closes higher than the one before it, that’s a sign the upward trend might continue. It’s like getting a thumbs-up from the market that things are looking positive.
Deciding on trade entry and exists points
The last step in trading with the bullish Harami pattern is actually making your trade based on the signals you’ve seen. Look for the confirmation candlestick, which is usually the third or fourth one after the pattern starts. This is the best time to jump in and make your trade. Try to get in just before this candlestick finishes closing to make the most profit. And don’t forget to set up stop losses to protect your investment and avoid big losses if the trade goes south. It’s like putting on a safety net to catch you if things don’t go as planned.
What Indicator is Best to Combine with Bullish Harami Candlestick Pattern?
The best indicators to use alongside the bullish Harami candlestick pattern are momentum-based ones like Moving Averages Convergence Divergence (MACD), the stochastic indicator, and the Relative Strength Indicator (RSI). These indicators help confirm the trend changes predicted by the Harami pattern. They work by showing if the market is overbought or oversold, which can back up the signals from the Harami pattern. If these indicators show that the market is oversold, it adds more confidence that the upward trend is likely to continue. It’s like having extra tools to double-check that the pattern you’re seeing is a good sign for your trade.